
Description
More details:
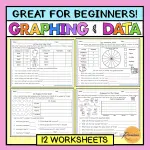
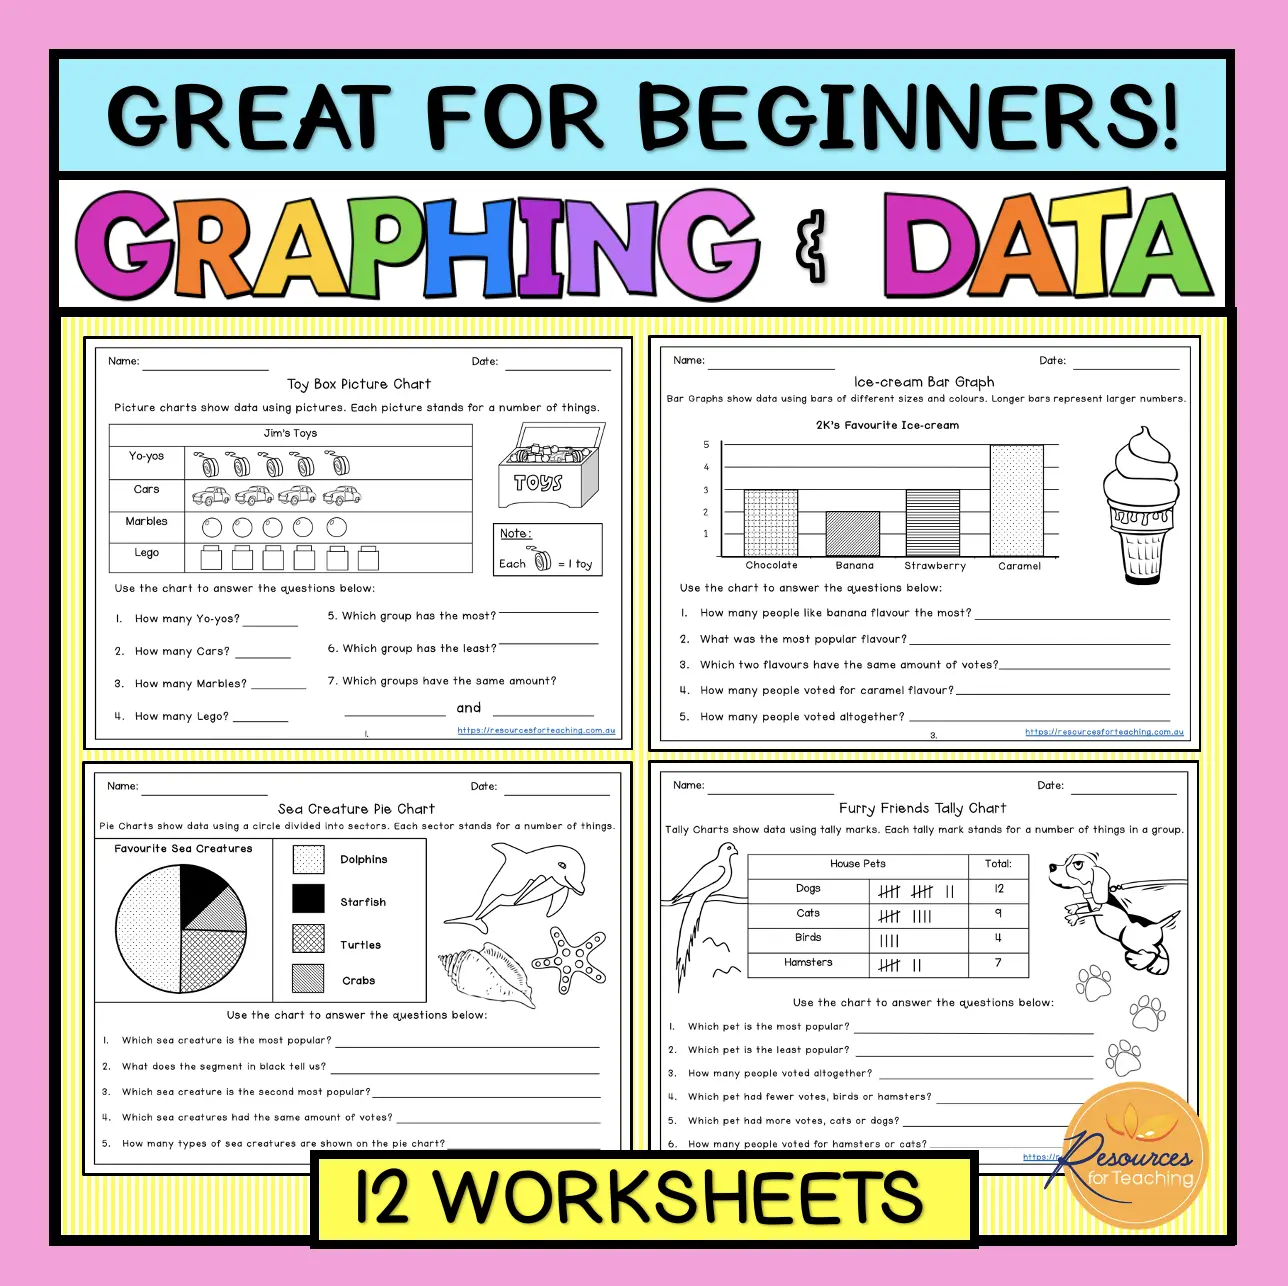
Page 1: Coversheet
Page 2: Toy Box Picture Chart (Easier)
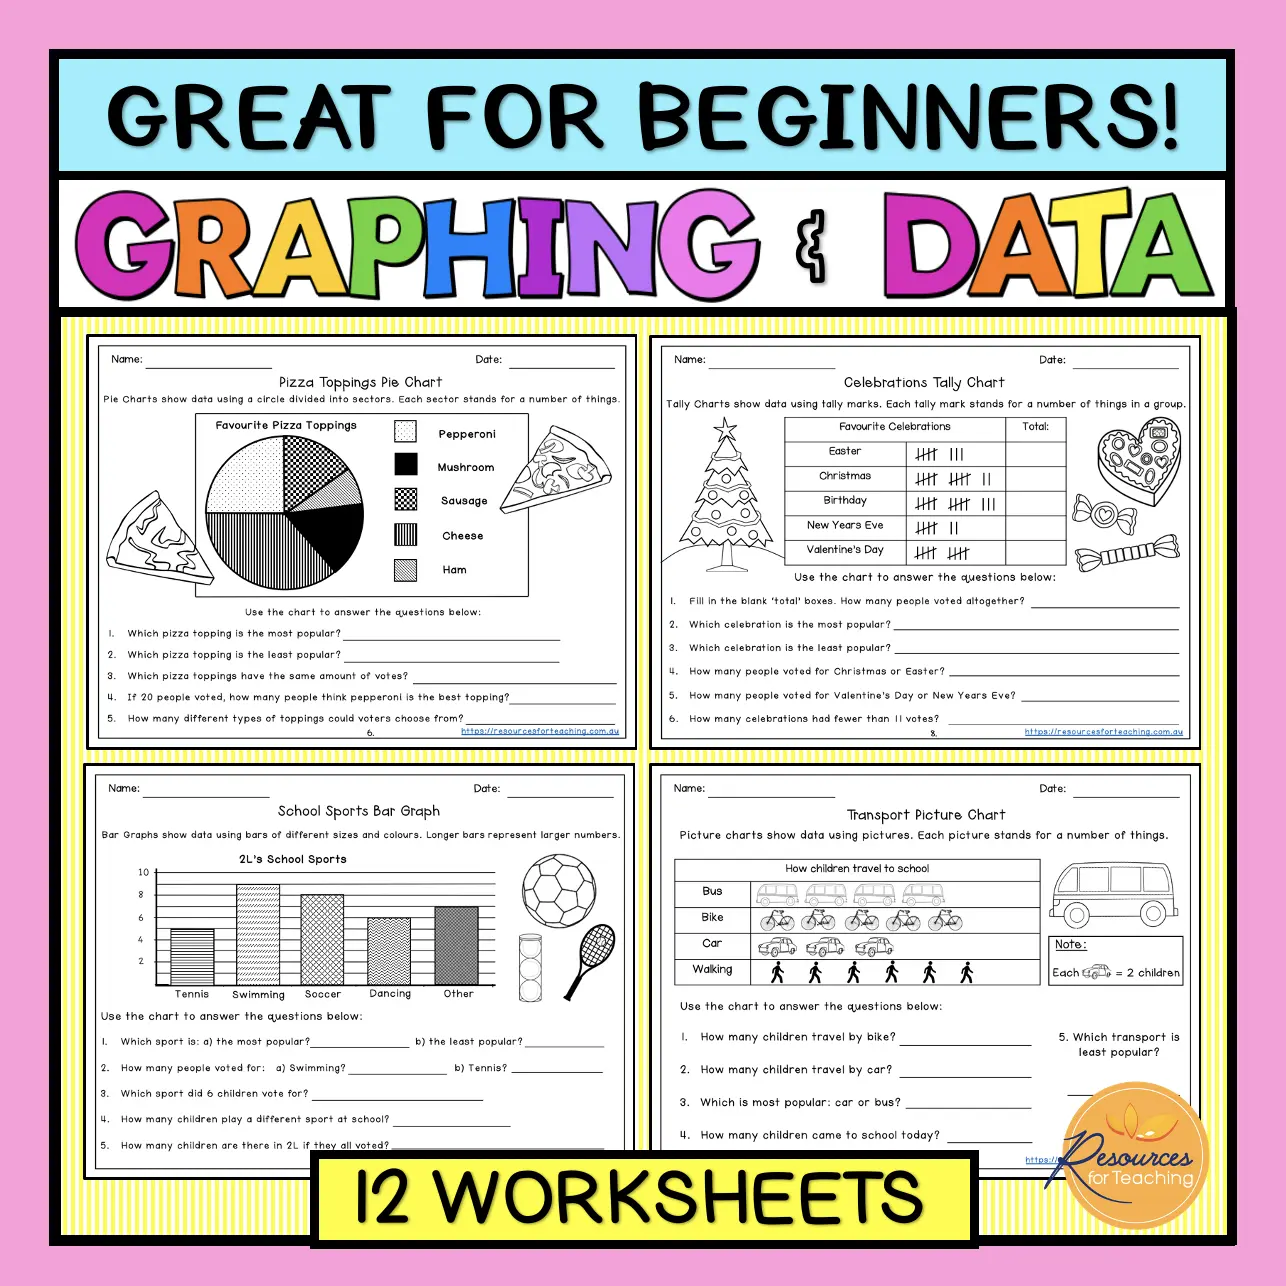
Page 3: Transport Picture Chart (Harder)
Page 4: Ice-cream Flavours Bar Graph (Easier)
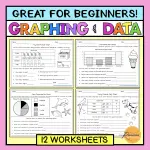
Page 5: School Sports Bar Graph (Harder)
Page 6: Sea Creatures Pie Chart (Easier)
Page 7: Pizza Toppings Pie Chart (Harder)
Page 8: Furry Friends Tally Chart (Easier)
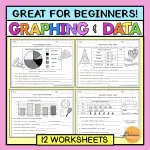
Page 9: Celebrations Tally Chart (Harder)
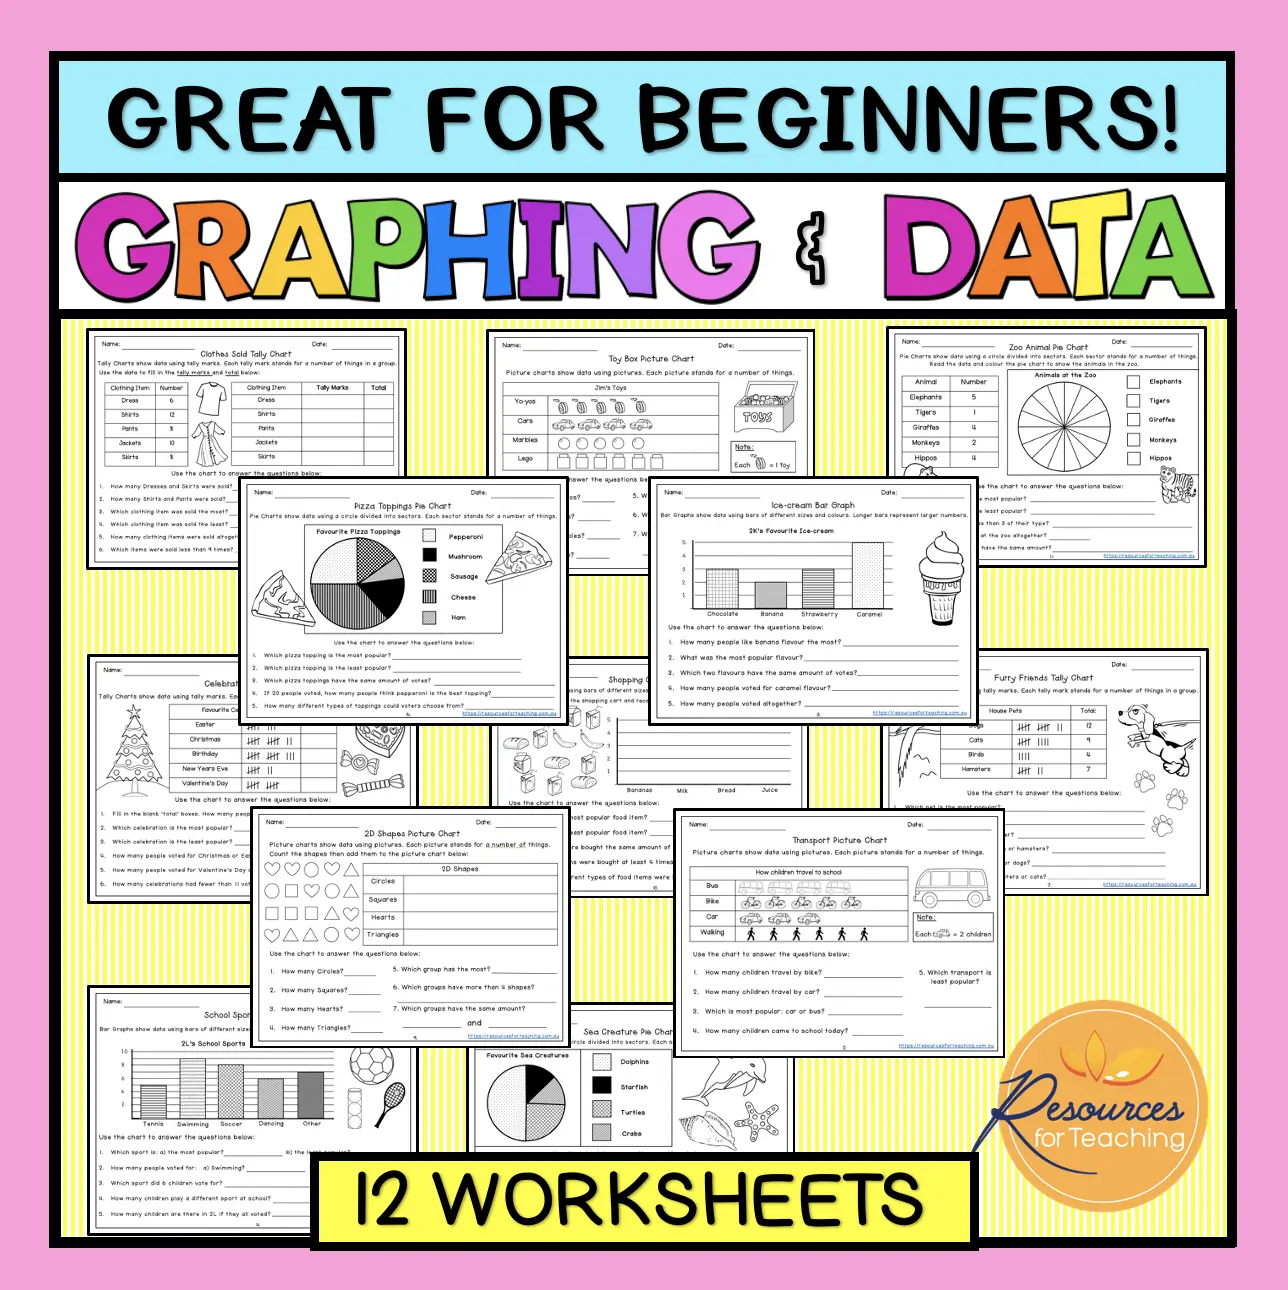
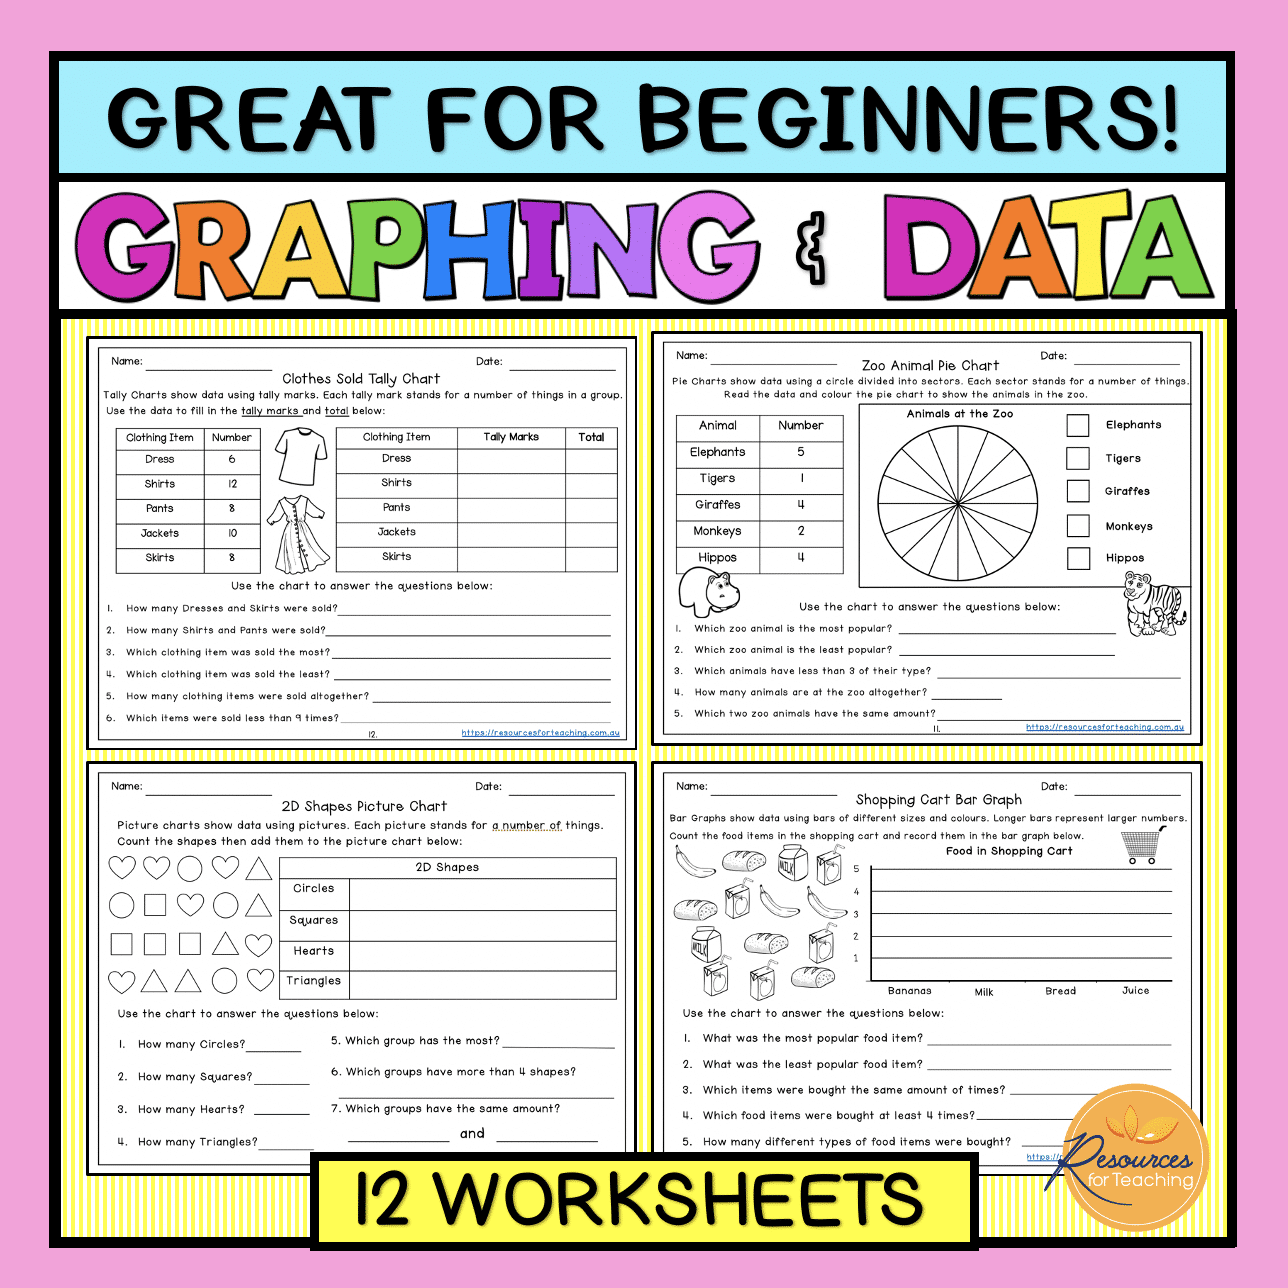
Page 10: 2D Shapes Picture Chart – Analyse data and create chart
Page 11: Shopping Cart Bar Graph – Analyse data and create graph
Page 12: Zoo Animal Pie Chart – Analyse data and create chart
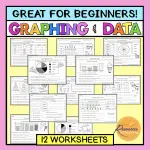
Page 13: Clothes Sold Tally Chart – Analyse data and create chart


