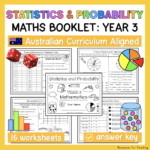
Statistics & Probability Booklet – Year 3

$5.00

Aligned to the Australian Curriculum. This printable booklet includes 16 worksheets to assist year 3 students learning about Statistics and Probability in the Mathematics syllabus. The main topics covered within this resource and strand of learning include:chance and data representation & interpretation

✩ ALL Year 3 Australian Curriculum Maths Outcomes are linked to this ‘Statistics and Probability’ booklet.

✩ Includes ANSWER KEY for easy marking!

The following outcomes are addressed in this pack:

ACMSP067 – Conduct chance experiments, identify and describe possible outcomes and recognise variation in results.
ACMSP068 – Identify questions or issues for categorical variables. Identify data sources and plan methods of data collection and recording.
ACMSP069 – Collect data, organise into categories and create displays using lists, tables, picture graphs and simple column graphs, with and without the use of digital technologies.
ACMSP070 – Interpret and compare data displays.
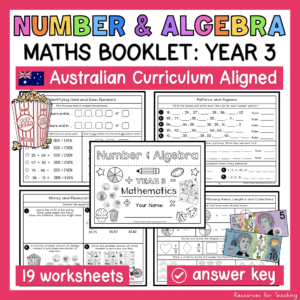
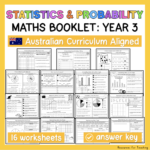
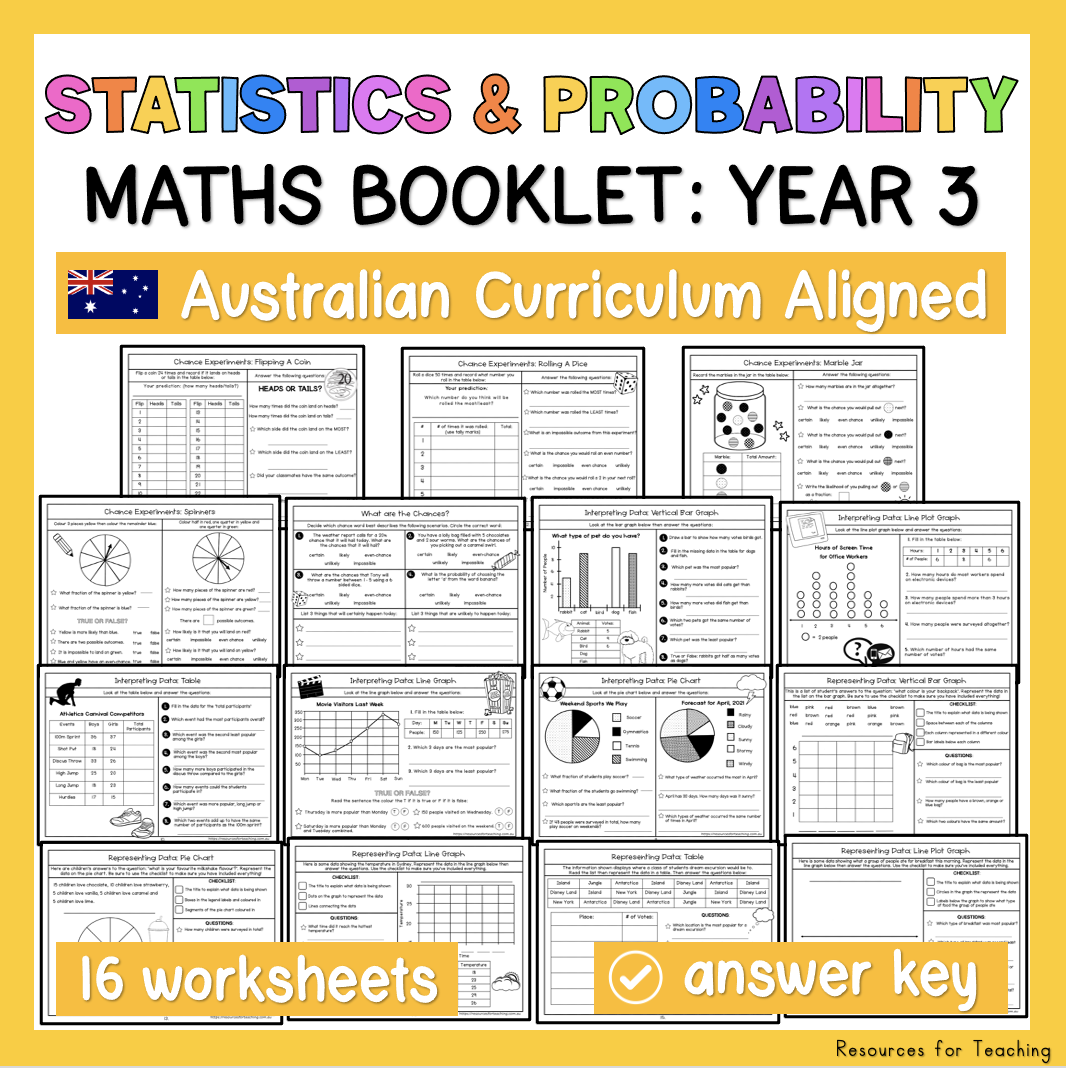
DISCLAIMER: These resources are electronic and available for downloading and printing. Resources for Teaching will not post a hard copy to your address. You can access the materials you have purchased by clicking on ‘My Account’ and ‘Downloads’. Please don’t hesitate to contact us via email: info@resourcesforteaching.com.au if you have any questions.

Additional information

File Size

3MB

Number of Pages

17

File Type

PDF

Description

More details about this product-
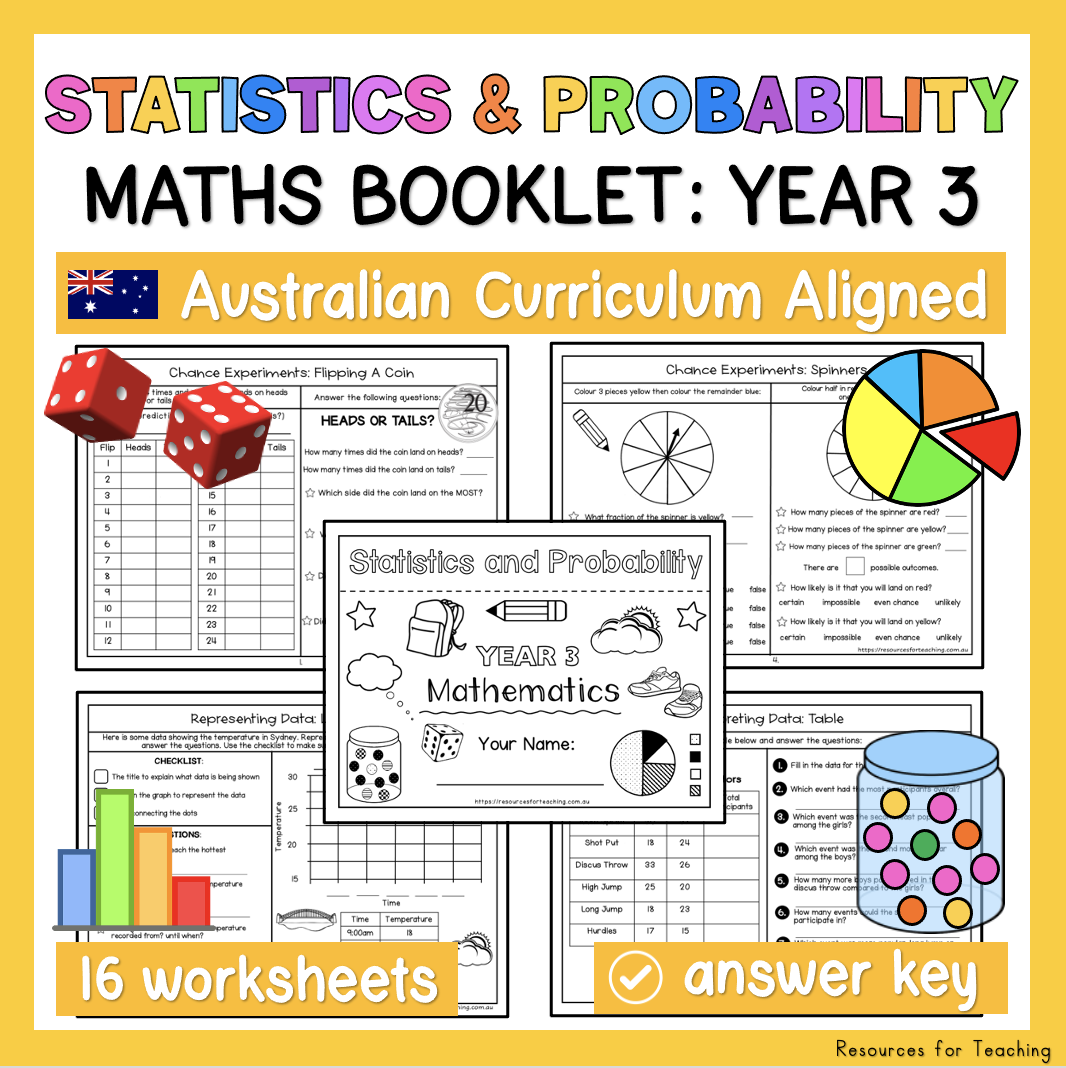
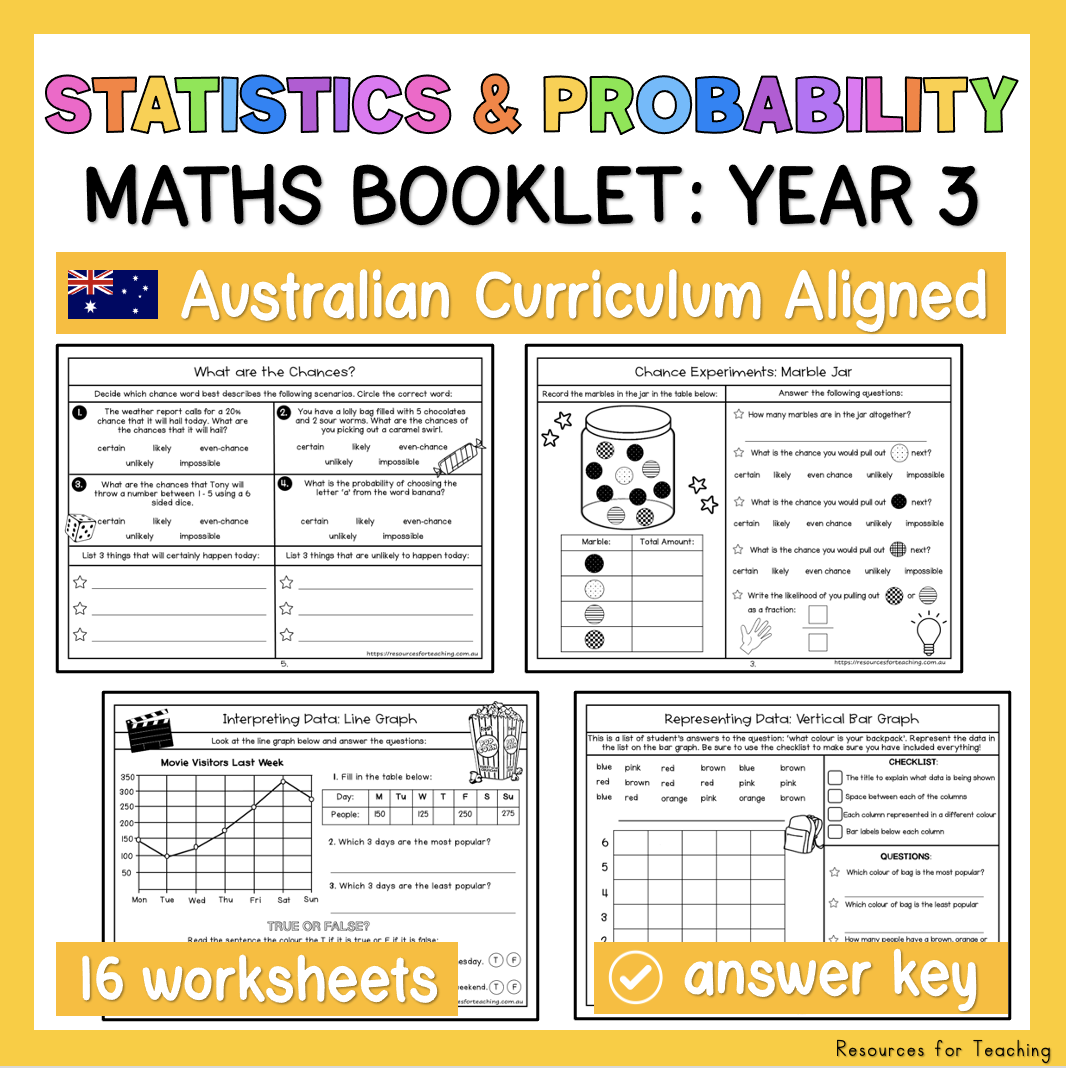
Page 1: Coversheet page with illustrations and spot to write name
Page 2: Chance Experiments – Flipping a Coin
Page 3: Chance Experiments – Rolling a Dice
Page 4: Chance Experiments – Marble Jar
Page 5: Chance Experiments – Spinners
Page 6: What are the Chances?
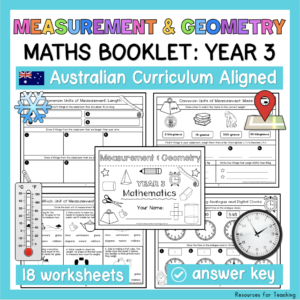
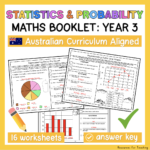
Page 7: Interpreting Data – Vertical Bar Graphs
Page 8: Interpreting Data – Horizontal Bar Graphs
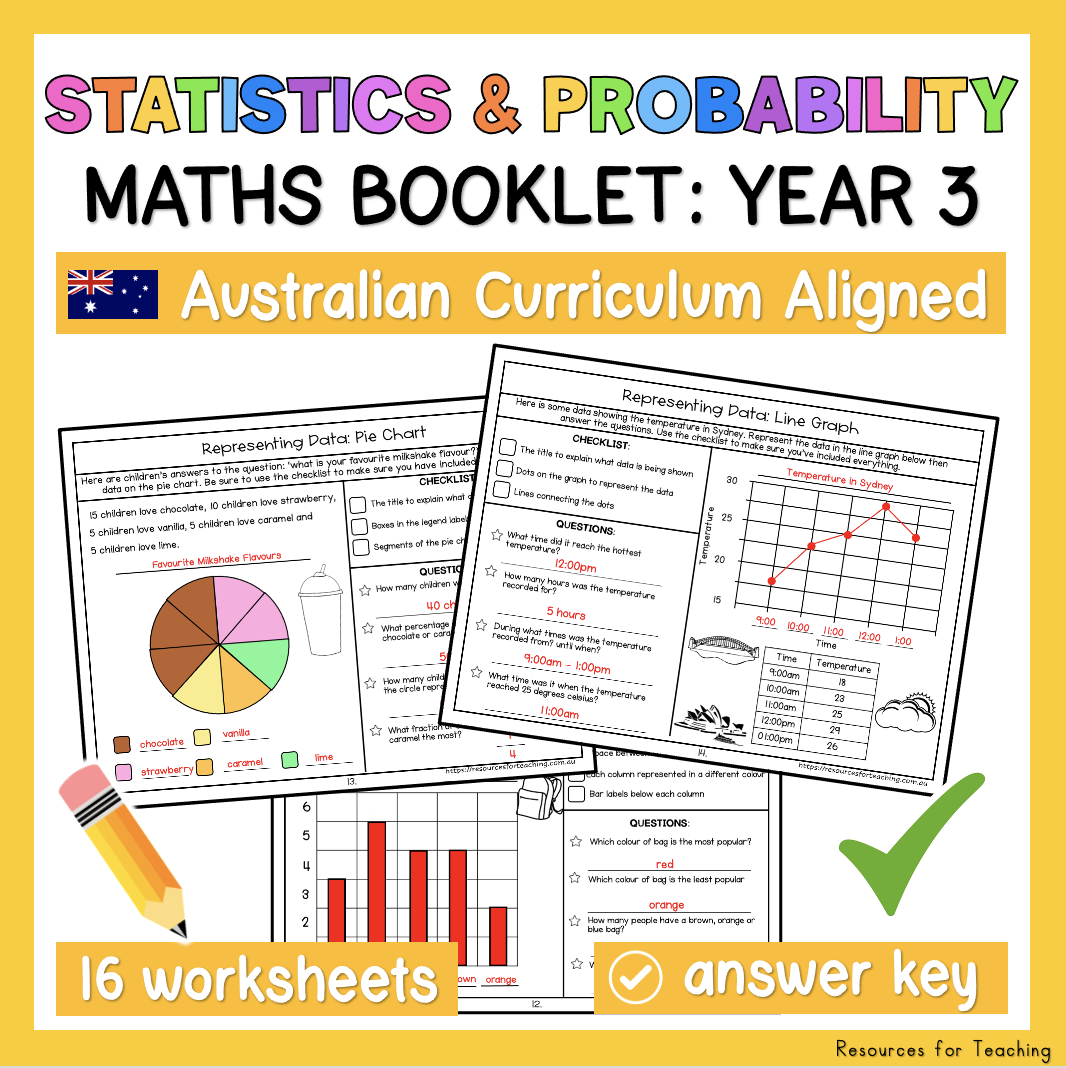
Page 9: Interpreting Data – Pie Charts
Page 10: Interpreting Data – Line Graphs
Page 11: Interpreting Data – Tables
Page 12: Interpreting Data – Line Plot Graphs
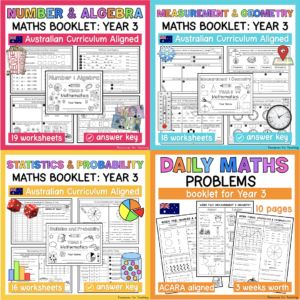
Page 13: Representing Data – Vertical Bar Graphs
Page 14: Representing Data – Pie Charts
Page 15: Representing Data – Line Graphs
Page 16: Representing Data – Tables
Page 17: Representing Data – Line Plot Graphs

Additional information

File Size

3MB

Number of Pages

17

File Type

PDF

Request a resource


    5/5

    Testimonials

    Maria from Cobbitty bought this product about 2 weeks ago
    Fran from Wilson bought this product about 1 week ago
    NIbal from Elizabeth east bought this product about 2 weeks ago
    Fran from Wilson bought this product about 1 week ago
    Fran from Wilson bought this product about 1 week ago