Description
The following outcomes are addressed in this pack:
ACMSP092 – Describe possible everyday events and order their chances of occurring
ACMSP093 – Identify everyday events where one cannot happen if the other happens
ACMSP094 – Identify events where the chance of one will not be affected by the occurrence of the other
ACMSP095 – Select and trial methods for data collection, including survey questions and recording sheets
ACMSP096 – Construct suitable data displays, with and without the use of digital technologies, from given or collected data. Include tables, column graphs and picture graphs where one picture can represent many data values
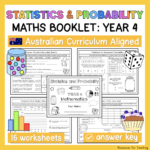
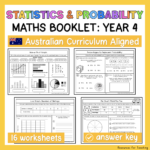
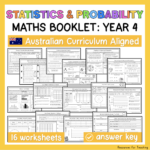
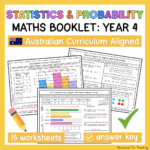
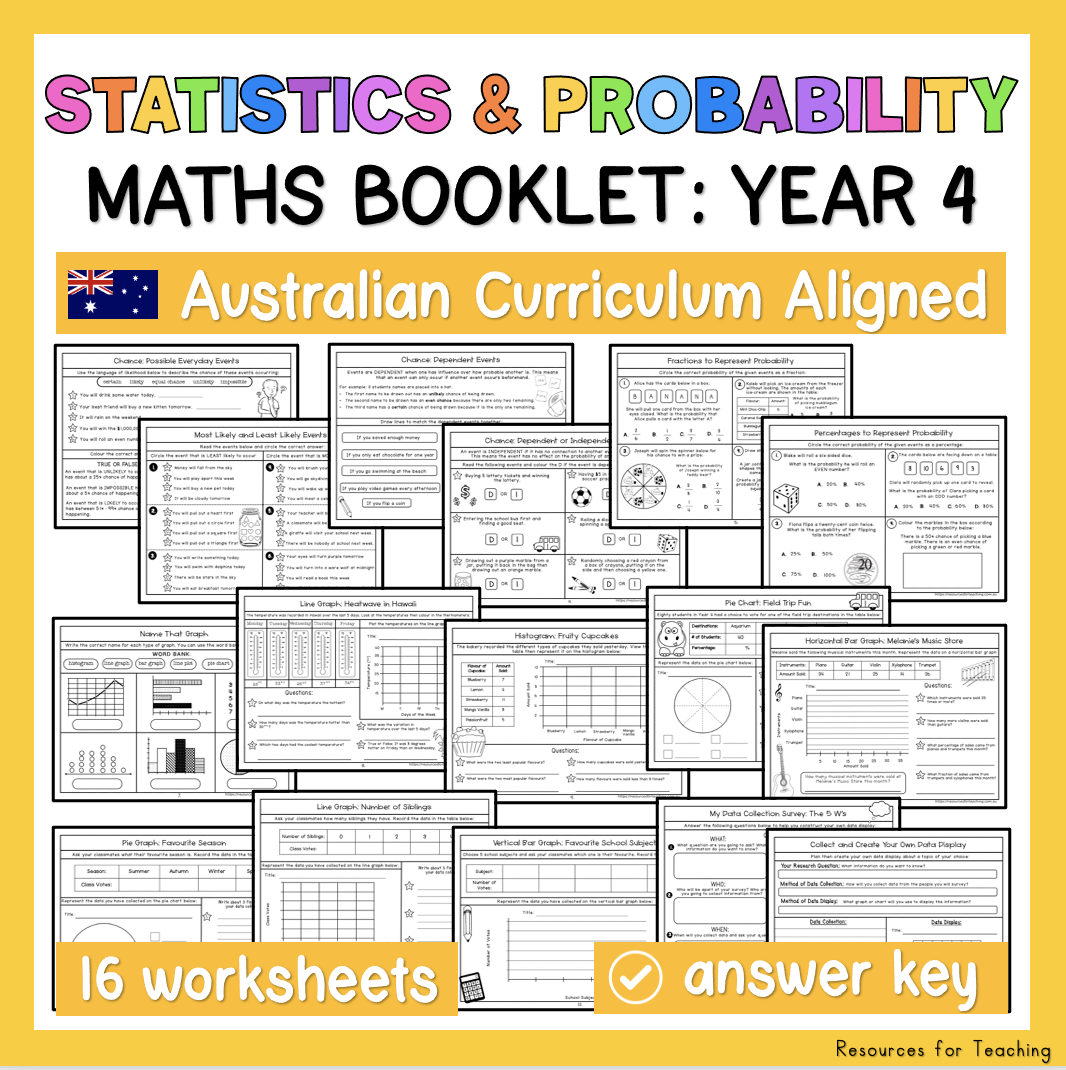
Worksheets:
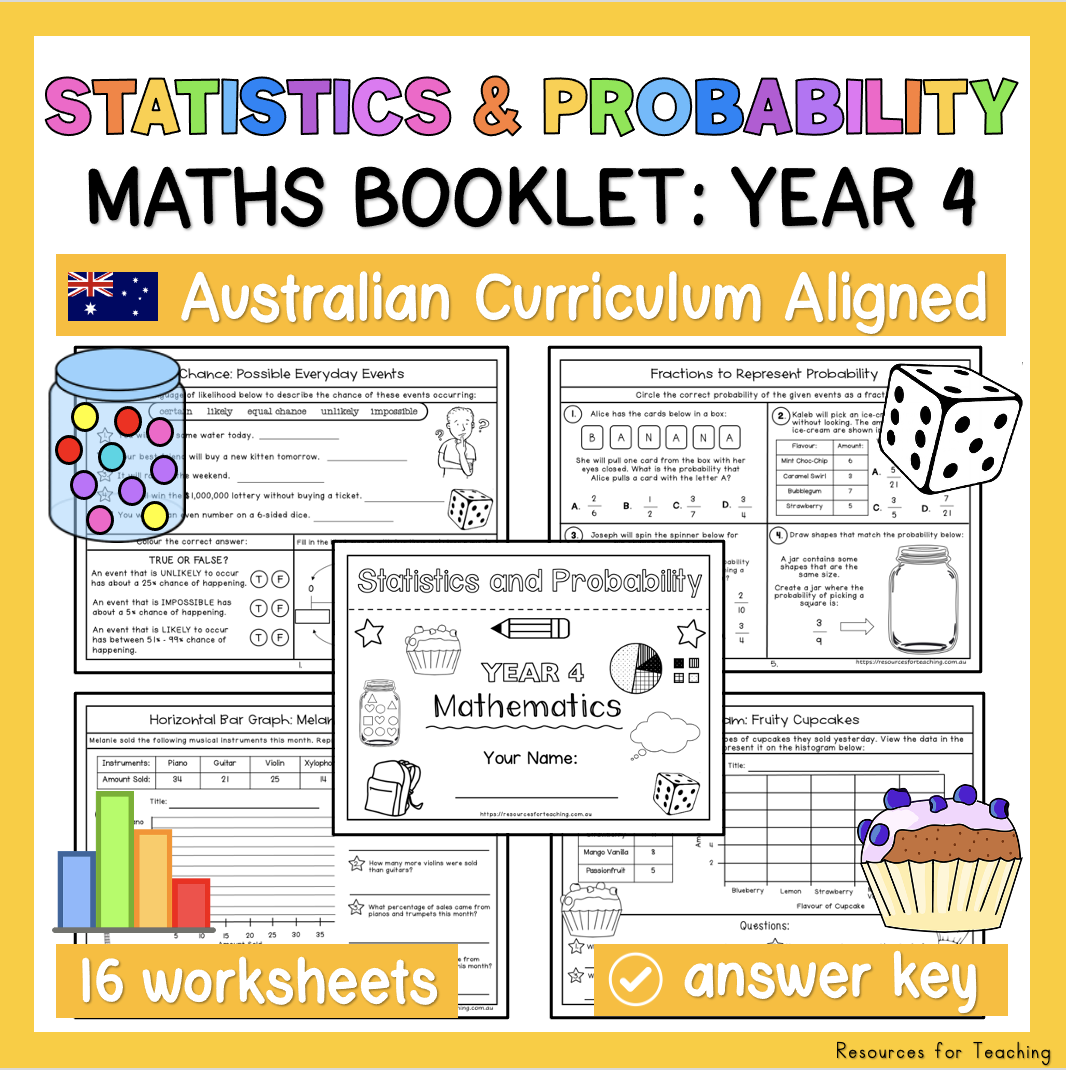
Page 1: Coversheet page with illustrations and spot to write name
Page 2: Chance: Possible Everyday Events
Page 3: Most Likely and Least Likely Events
Page 4: Chance: Dependent Events
Page 5: Chance: Dependent or Independent Event?
Page 6: Fractions to Represent Probability
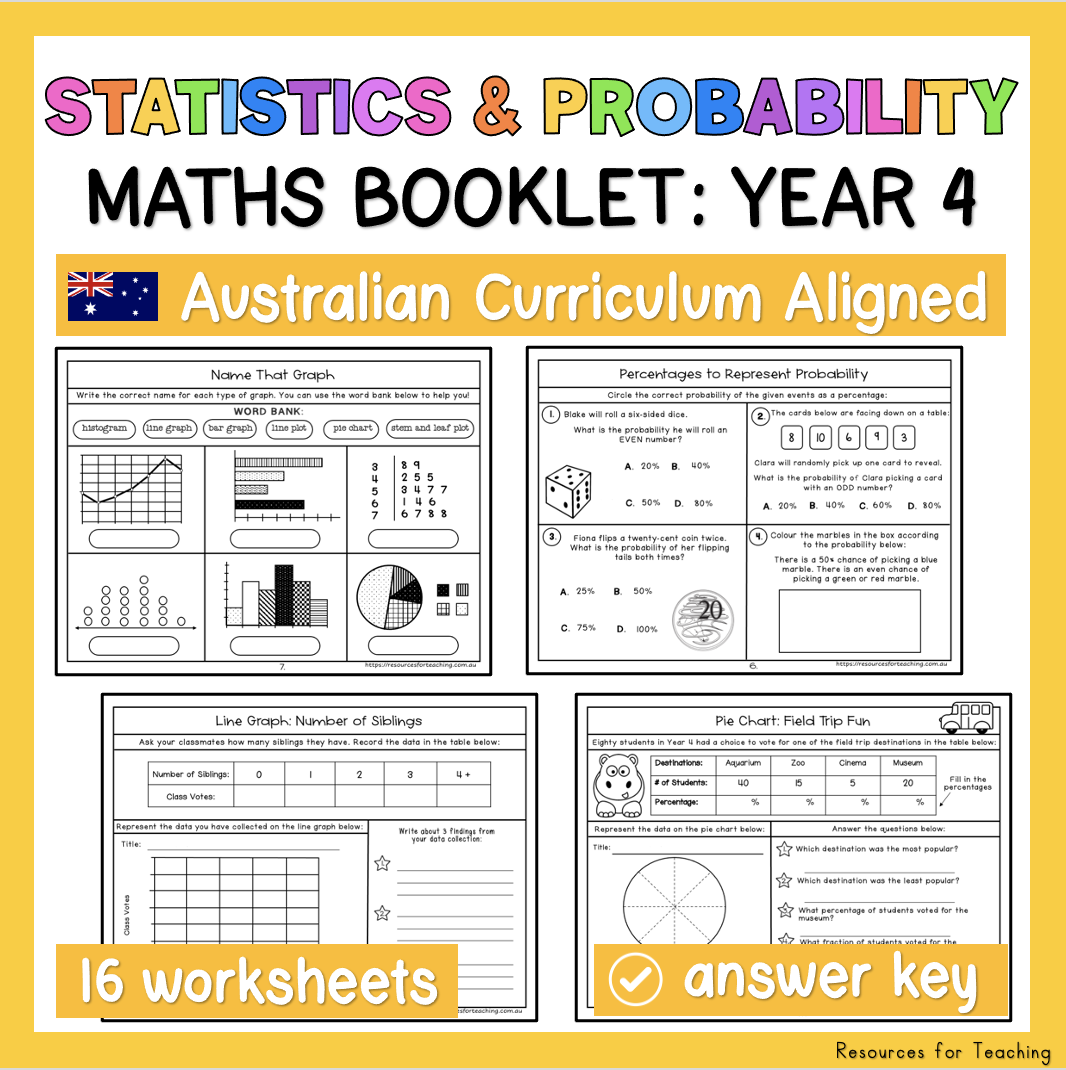
Page 7: Percentages to Represent Probability
Page 8: Name That Graph (histogram, line graph, bar graph, line plot, pie chart, stem and leaf plot)
Page 9: Line Graph: Heatwave in Hawaii
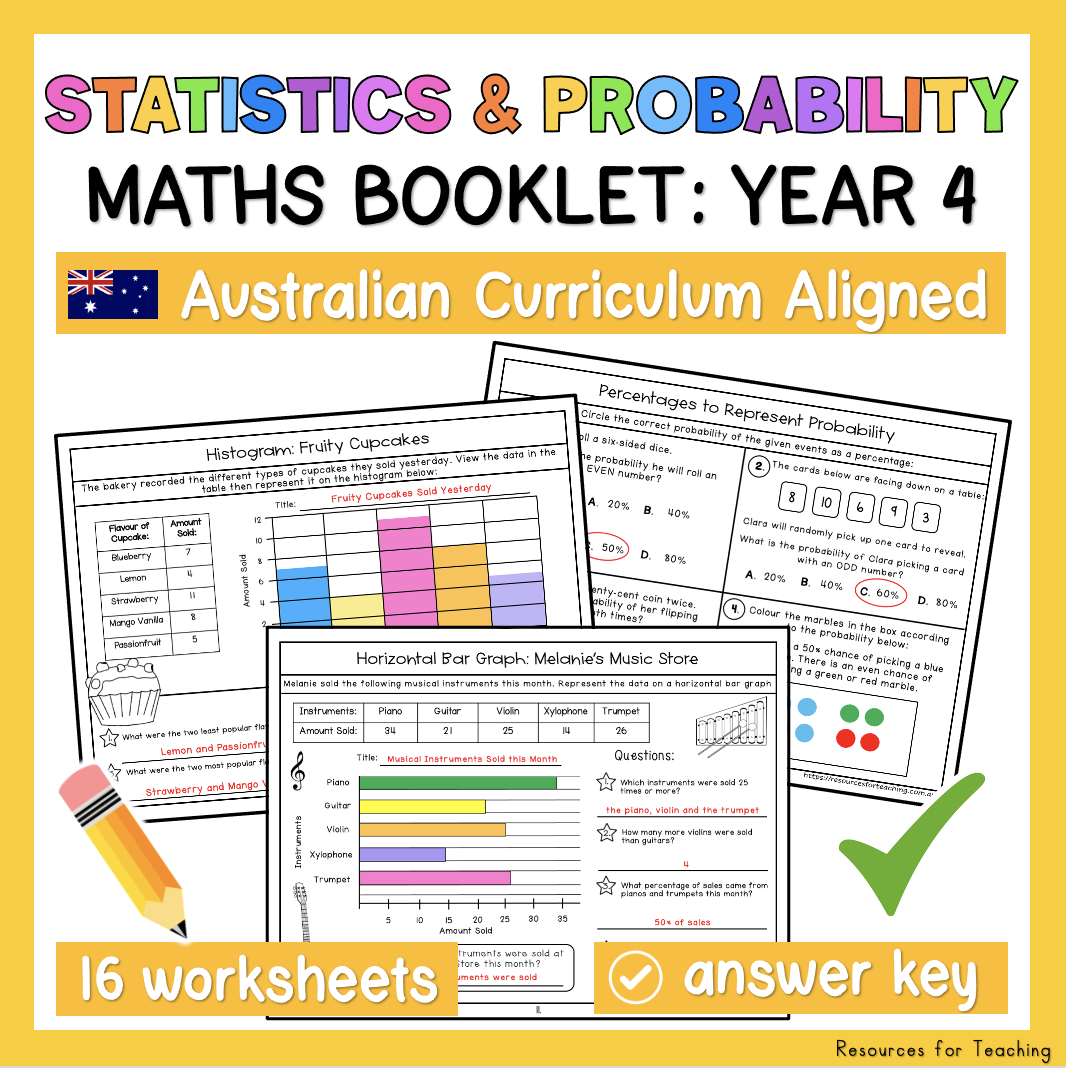
Page 10: Histogram: Fruity Cupcakes
Page 11: Pie Chart: Field Trip Fun
Page 12: Horizontal Bar Graph: Melanie’s Music Store
Page 13: My Data Collection Survey: The 5 W’s
Page 14: Vertical Bar Graph: Favourite School Subject
Page 15: Line Graph: Number of Siblings
Page 16: Pie Graph: Favourite Season
Page 17: Collect and Create Your Own Data Display Template

